AI16Z jumps 28% as AI crypto recovers from latest correction

While the RSI suggests momentum recovery and the DMI suggests a possible uptrend, the EMA lines reveal that the price lacks bullish confirmation. The next few sessions will now determine if AI16Z can sustain this momentum and challenge its key resistance levels.
AI16Z RSI recovers after oversold
In record time, the RSI of the AI16Z coin soared to 52.4 from yesterday’s 28.8. This indicates a significant change in Momentum after moving into oversold. But still, the speed of this increase highlights the growing interest in buying after massive profit-taking. Now the downward pressure has eased.
The current RSI level reflects a balanced market with no advantage for either buyers or sellers. However, the recent upward trajectory gives hope for an upward trend.
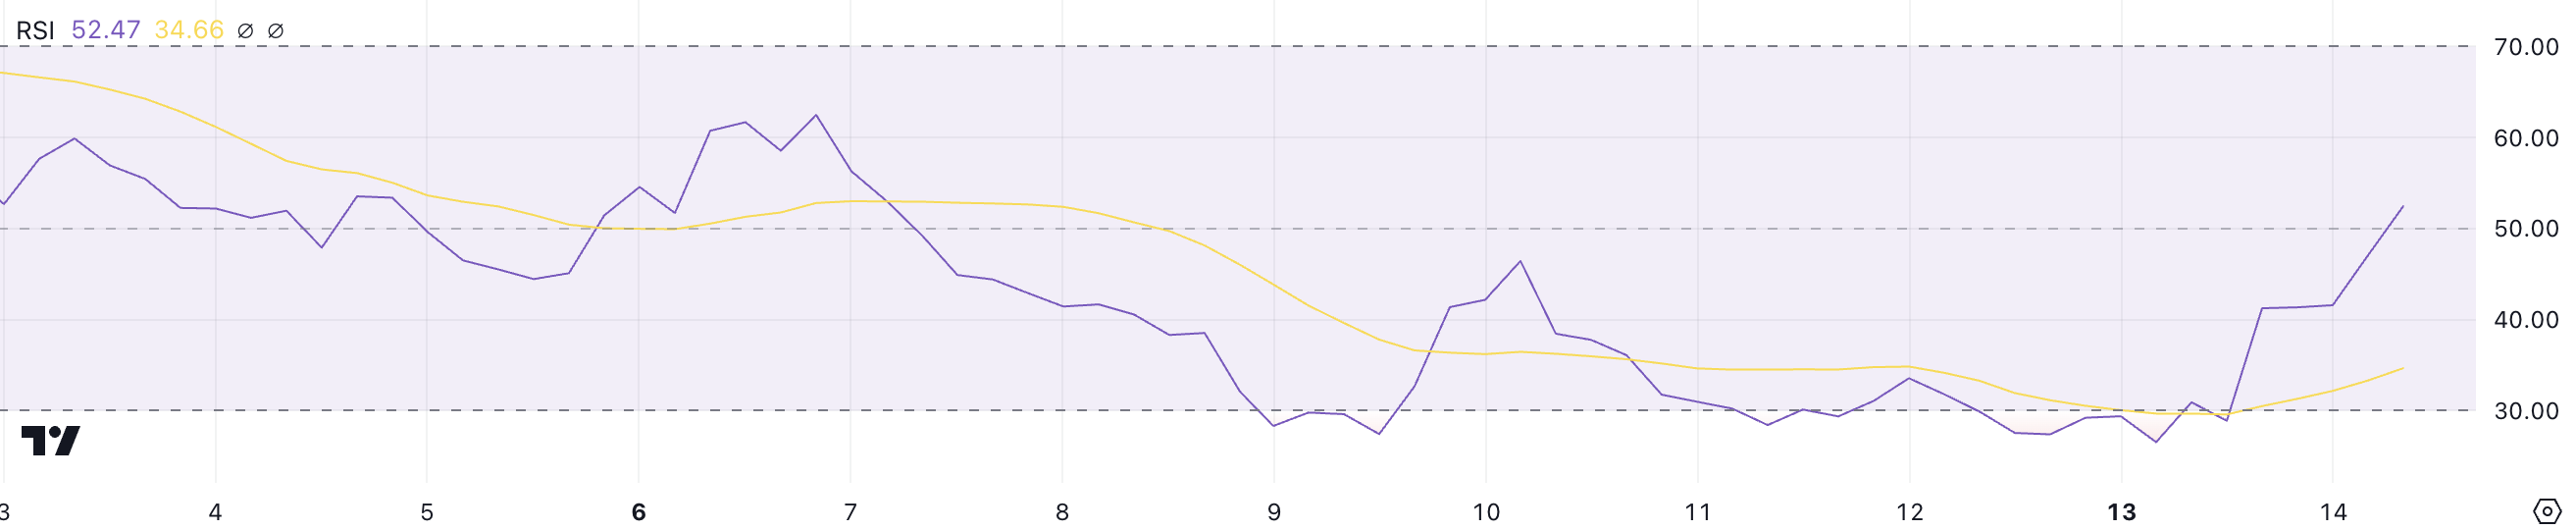
The RSI, or relative strength index, measures the speed and magnitude of price movements on a range from 0 to 100. Levels below 30 indicate oversold conditions, often signaling potential price upside. On the other hand, levels above 70 indicate overbought conditions where a pullback could occur.
With RSI AI16Z at 52.4, the asset is in a neutral, slightly bullish zone. This could mean that further price recovery is possible, but sustained Momentum will be crucial to move into a more intense bullish phase. Conversely, failure to maintain this upward momentum could lead to consolidation or renewed selling pressure.
The DMI indicates the emergence of an uptrend
The DMI AI16Z chart shows that its ADX has dropped to 25.6 from yesterday’s 32.5. This decline tells us a decline in the overall strength of the trend.
However, the ADX remains above the critical threshold, which means that the trend is still present, albeit weaker than before.
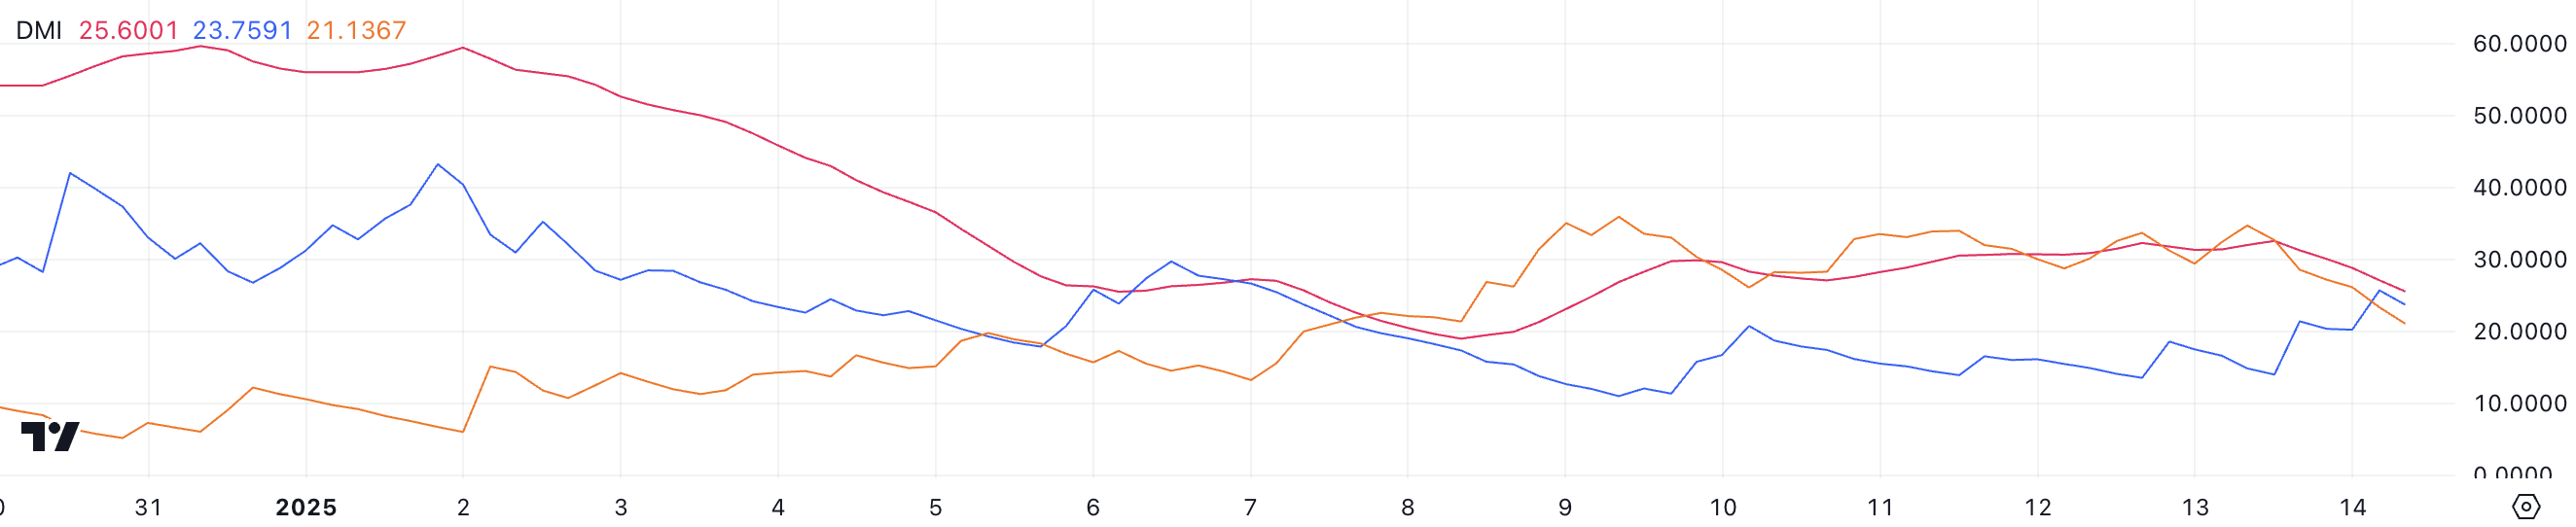
The ADX, or Average Directional Index, measures the strength of a trend without indicating its direction. Values below 20 indicate a weak or no trend, while values above 25 indicate a strong trend. For AI16Z, +DI, representing bullish pressure, increased from 14 to 23.7, reflecting increasing buying momentum. How AI cryptocurrencies are trying to recover from recent strong corrections.
Meanwhile, -DI, representing bearish pressure, fell sharply from 34.7 to 21, indicating an easing of selling pressure. This change means buyers are gradually taking control. If the ADX stabilizes or rises, the price of AI16Z could confirm an uptrend. However, if the ADX continues to decline, it could indicate a consolidation rather than a strong move up.
Price prediction for AI16Z
The price chart shows that the short-term EMA lines remain below the long-term ones. Generally, these kinds of setups signal bearish momentum. However, the upward movement of these lines indicates the upcoming establishment of an uptrend.
If this uptrend materializes, the AI cryptocurrency price could test the next resistance at $1.39. A successful breakout above this level could pave the way for further gains. Potentially, the price of the asset could go as high as $1.74. This scenario could happen very soon once the AI Agents storyline picks up again.
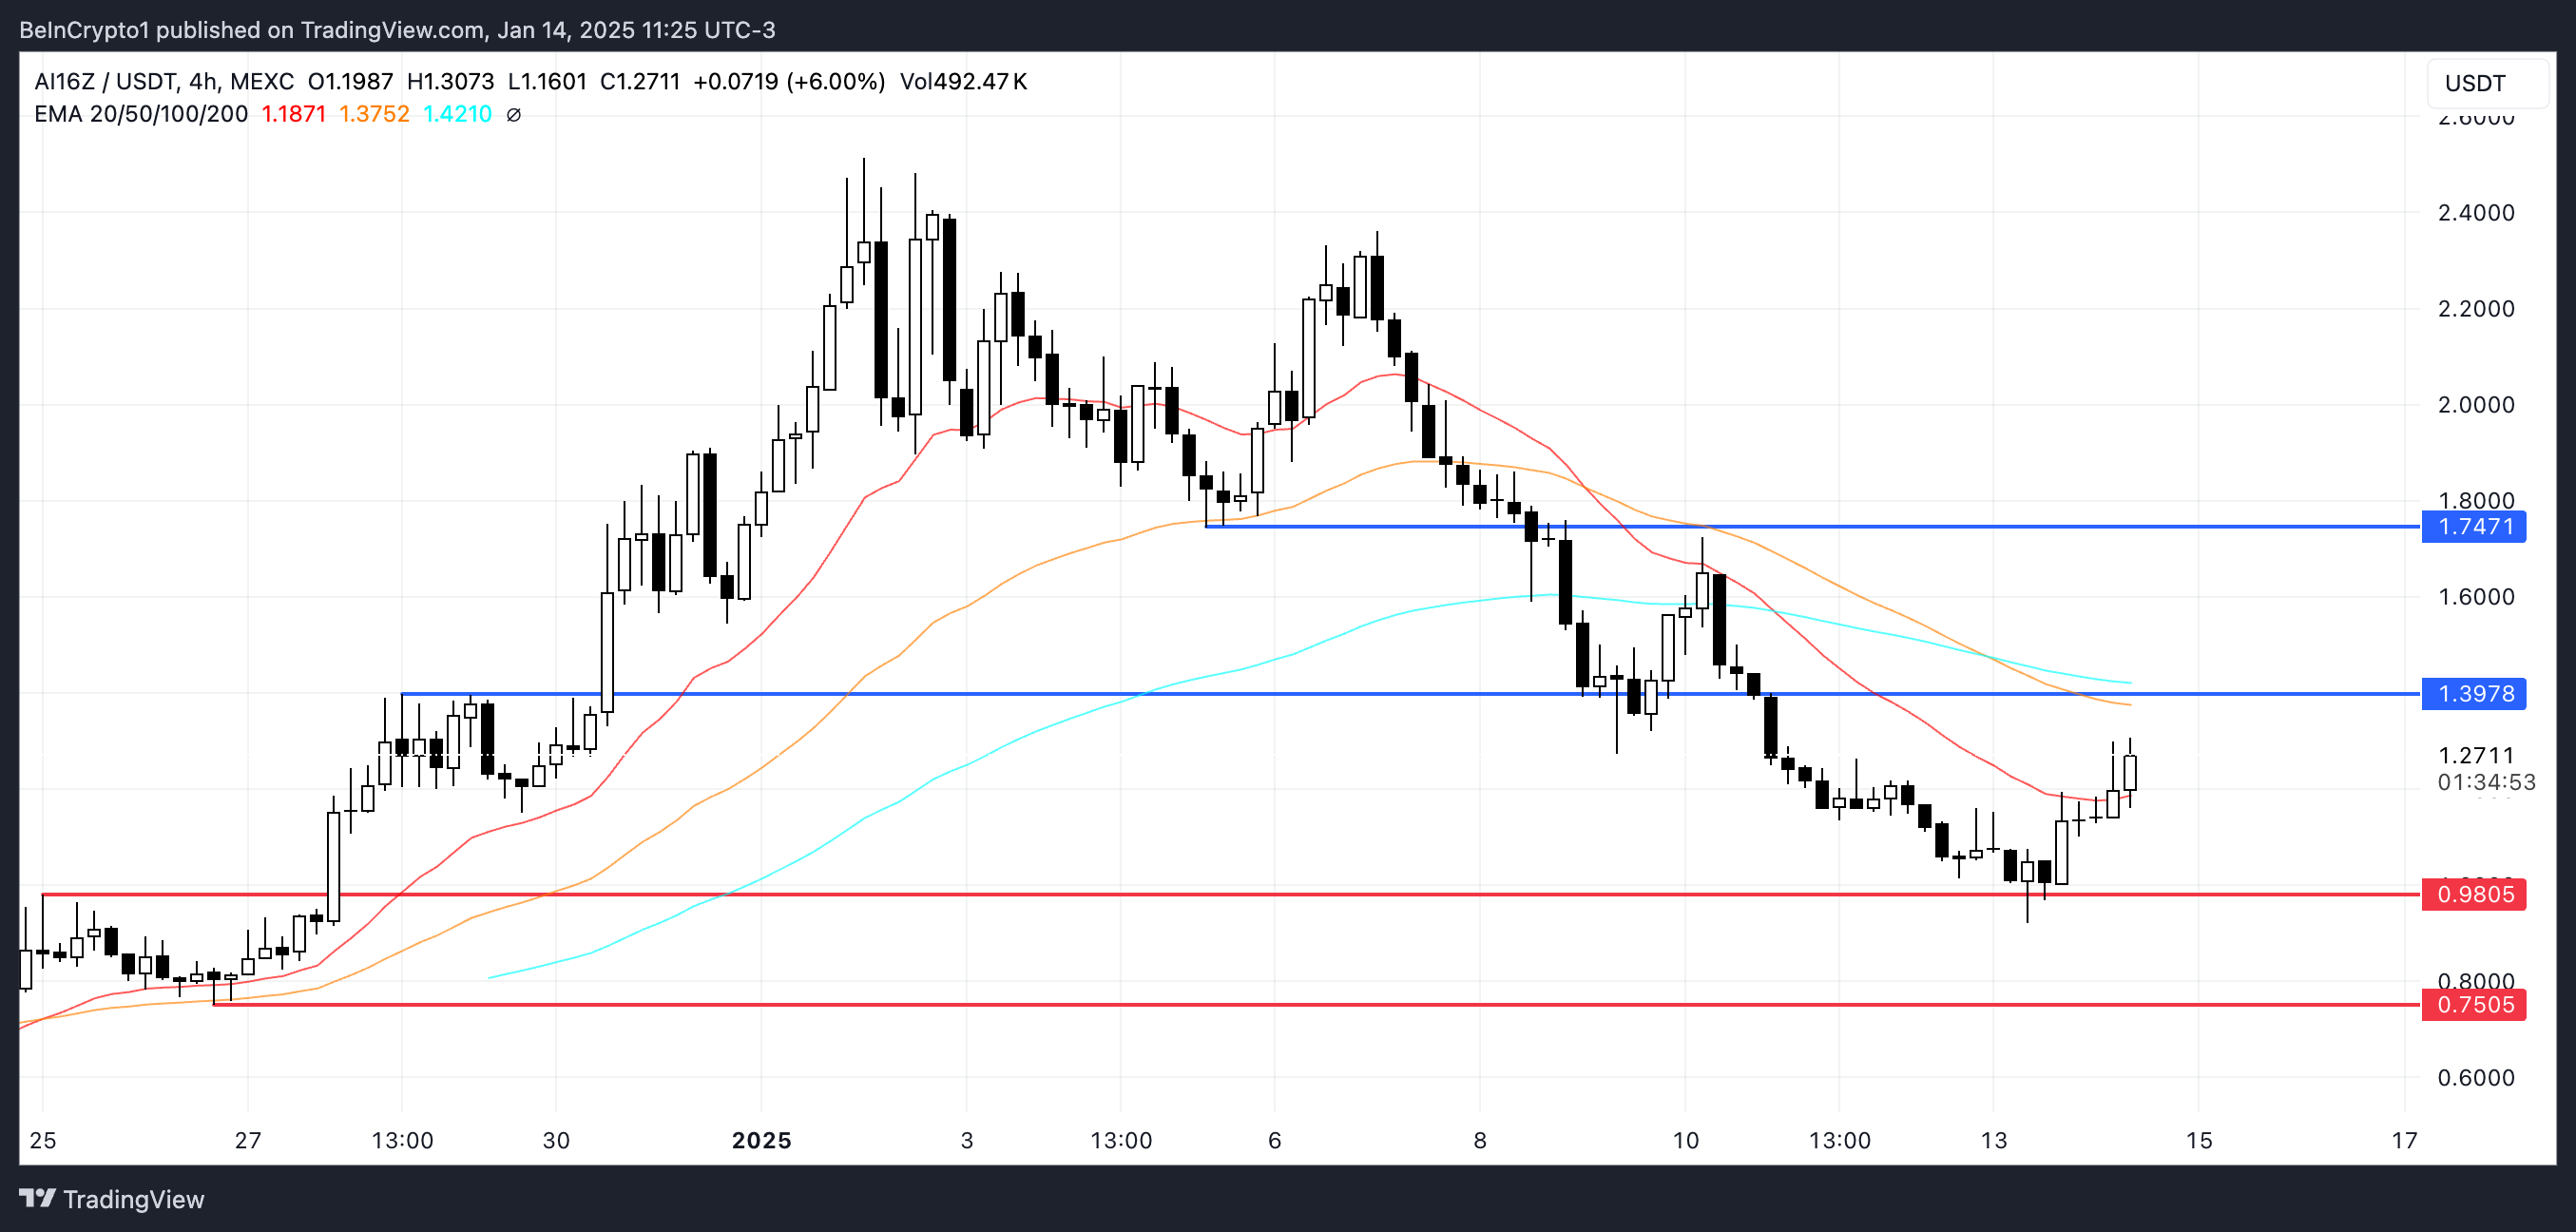
Conversely, if the uptrend does not hold, the price of AI16Z could return to test support at $0.98. If this support level is broken, the price could fall to $0.75, leading to a deeper decline.
Moral of the story: sometimes you have to play on your name to get a good spot.
Disclaimer
Disclaimer: In accordance with The Trust Project guidelines, this price analysis article is for informational purposes only and should not be considered financial or investment advice. BeInCrypto is committed to providing accurate and unbiased information, but market conditions may change without notice. Always do your own research and consult with an expert before making any financial decision.


Post Comment